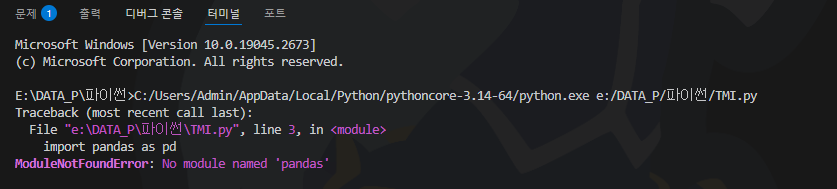
C:/Users/Admin/AppData/Local/Python/pythoncore-3.14-64/python.exe -m pip install pandasC:/Users/Admin/AppData/Local/Python/pythoncore-3.14-64/python.exe -m pip install pandas matplotlib
주피터 설치
C:/Users/Admin/AppData/Local/Python/pythoncore-3.14-64/python.exe -m pip install notebook
# 미세먼지 수준에 따라 강남역 2호선 이용객 수 평균이 어떻게 달라지는지
import pandas as pd
import glob
import os
import matplotlib.pyplot as plt

plt.rcParams["font.family"] = "Malgun Gothic"
plt.rcParams["axes.unicode_minus"] = False

# =========================================================
# 0. 파일 경로 설정
# =========================================================
base_path = r"E:\DATA_P\파이썬미니프로젝트\TMI"

print("기준 폴더:", base_path)
print("폴더 존재 여부:", os.path.exists(base_path))
print("폴더 안 파일들:")
print(os.listdir(base_path))

# =========================================================
# 1. 지하철 데이터 불러오기
# =========================================================
subway_files = glob.glob(os.path.join(base_path, "CARD_SUBWAY_MONTH_*.csv"))
print("찾은 지하철 파일:", subway_files)

subway_list = []

for file in subway_files:
    print("\n읽는 중:", file)

    df = pd.read_csv(
        file,
        encoding="utf-8",
        index_col=False
    )

    df.columns = df.columns.str.strip()

    print("원본 컬럼명:", list(df.columns))
    print(df.head())

    # 필요한 컬럼만 선택
    df = df[["사용일자", "노선명", "역명", "승차총승객수", "하차총승객수"]].copy()

    # 날짜형 변환
    df["사용일자"] = pd.to_datetime(df["사용일자"].astype(str), format="%Y%m%d")

    subway_list.append(df)

if not subway_list:
    raise FileNotFoundError("지하철 CSV 파일을 찾지 못했습니다.")

subway = pd.concat(subway_list, ignore_index=True)

print("\n전체 지하철 데이터")
print(subway.head())
print(subway.info())

# =========================================================
# 2. 2호선 전체만 필터링
# =========================================================
line2 = subway[
    subway["노선명"] == "2호선"
].copy()

# 날짜별 2호선 전체 승객수 합계
line2_daily = (
    line2.groupby("사용일자", as_index=False)[["승차총승객수", "하차총승객수"]]
    .sum()
)

# 총 승객수 컬럼 추가
line2_daily["총승객수"] = (
    line2_daily["승차총승객수"] + line2_daily["하차총승객수"]
)

print("2호선 전체 일별 데이터")
print(line2_daily.head())
print()
print(line2_daily.info())
print()

# =========================================================
# 3. 미세먼지 데이터 불러오기
# =========================================================
dust_files = glob.glob(os.path.join(base_path, "*대기환경*2025.csv")) + \
             glob.glob(os.path.join(base_path, "*대기환경*2026.csv"))

dust_list = []

for file in dust_files:
    df = pd.read_csv(file, encoding="cp949")

    df = df[["측정일자", "미세먼지(㎍/㎥)", "초미세먼지(㎍/㎥)"]]
    df["측정일자"] = pd.to_datetime(df["측정일자"].astype(str), format="%Y%m%d")

    dust_list.append(df)

dust = pd.concat(dust_list, ignore_index=True)

# 서울 전체 일평균
dust_daily = (
    dust.groupby("측정일자", as_index=False)[["미세먼지(㎍/㎥)", "초미세먼지(㎍/㎥)"]]
    .mean()
)

dust_daily.columns = ["날짜", "미세먼지", "초미세먼지"]

print("미세먼지 데이터")
print(dust_daily.head())
print()


# =========================================================
# 4. 강수량 데이터 불러오기
#    - 앞 6줄은 설명행이므로 skiprows=6
# =========================================================
rain_file = glob.glob(os.path.join(base_path, "*강수량*.csv"))[0]

rain = pd.read_csv(
    rain_file,
    encoding="cp949",
    skiprows=6
)

rain = rain[["날짜", "강수량(mm)"]]
rain["날짜"] = pd.to_datetime(rain["날짜"])
rain["강수량(mm)"] = rain["강수량(mm)"].fillna(0)

rain.columns = ["날짜", "강수량"]

print("강수량 데이터")
print(rain.head())
print()


# =========================================================
# 5. 날짜 기준 병합
# =========================================================
line2_daily = line2_daily.rename(columns={"사용일자": "날짜"})

merged = pd.merge(line2_daily, dust_daily, on="날짜", how="inner")
merged = pd.merge(merged, rain, on="날짜", how="left")

merged["강수량"] = merged["강수량"].fillna(0)

# =========================================================
# 6. 분석용 파생 변수 추가
# =========================================================
merged["요일"] = merged["날짜"].dt.day_name()
merged["주말여부"] = merged["날짜"].dt.weekday >= 5
merged["월"] = merged["날짜"].dt.month

def dust_grade(x):
    if x <= 30:
        return "좋음"
    elif x <= 80:
        return "보통"
    elif x <= 150:
        return "나쁨"
    else:
        return "매우나쁨"

merged["미세먼지등급"] = merged["미세먼지"].apply(dust_grade)

print("최종 병합 데이터")
print(merged.head())
print()
print(merged.info())


# =========================================================
# 7. 저장
# =========================================================
merged.to_csv("line2_dust_rain_merged.csv", index=False, encoding="utf-8-sig")
print("\n저장 완료: line2_dust_rain_merged.csv")

# 데이터가 잘 합쳐졌는지 먼저 확인
print(merged.head())
print(merged.info())
print(merged.describe())

# 상관관계 확인
print(merged[["총승객수", "미세먼지", "초미세먼지", "강수량"]].corr())


# 미세먼지 등급별 평균 총승객수
result = merged.groupby("미세먼지등급")["총승객수"].mean()
plt.figure(figsize=(8, 5))
plt.bar(result.index, result.values)
plt.xlabel("미세먼지 등급")
plt.ylabel("평균 총승객수")
plt.title("미세먼지 등급별 2호선 전체 평균 총승객수")
plt.show()'🍏 개발일기' 카테고리의 다른 글
| HTTP 메서드에 대해서 : GET, POST, PUT, PATCH, DELETE (0) | 2026.03.26 |
|---|---|
| REST API 요청 흐름 (0) | 2026.03.24 |
| OAuth (0) | 2026.03.19 |
| CSV 파일 데이터를 읽어서 시각화 해보기 (0) | 2026.03.18 |
| CSV 파일을 활용한 온도 데이터 시각화 (0) | 2026.03.17 |